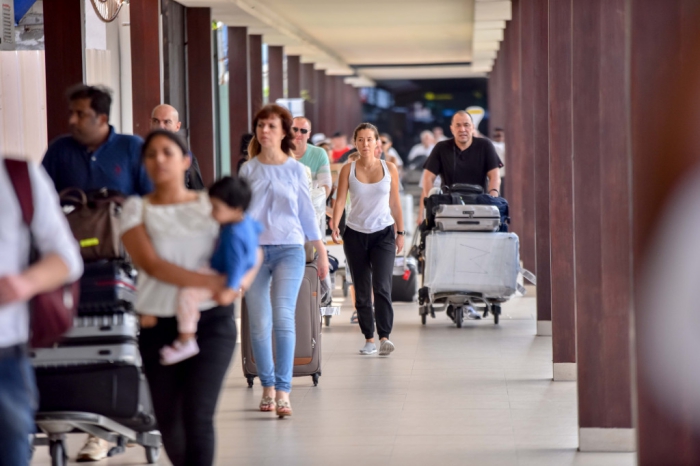
The most recent statistics from the Ministry of Tourism confirmed that tourist arrivals so far in were3 were up by 7.0% compared to the same duration in 2022.
Arrival Differences
- 2021: 13,008 arrivals
- 2022: 20,842 arrivals
- 2023: 22,297 arrivals
* arrival count as of 04th January 2023
With a cumulative arrival total of 22,297 by 04th January, the daily arrival average of tourists to the Maldives stood at 5,574. The current average duration of stay for guests is 8.1 days.
Meanwhile, there are notable differences in the top ten source markets to the Maldives so far in 2023; though this is likely to change in the coming weeks.
Top 10 Markets of 2023
- Russia: 4,402 | 19.7%
- Italy: 3,854 | 17.3%
- India: 1,605 | 7.2%
- UK: 1,261 | 5.7%
- Germany: 1,242 | 5.6%
- USA: 990 | 4.4%
- Kazakhstan: 687 | 3.1%
- France: 514 | 2.3%
- Switzerland: 457 | 2.0%
- Sweden: 420 | 1.9%
* numbers indicate arrivals so far in 2023
Top 10 Markets of 2022
- India: 241,369 | 14.4%
- Russia: 201,957 | 12.1%
- UK: 179,312 | 10.7%
- Germany: 133,424 | 8.0%
- Italy: 97,627 | 5.8%
- USA: 80,691 | 4.8%
- France: 48,340 | 2.9%
- Spain: 42,123 | 2.5%
- South Korea: 35,947 | 2.1%
- Switzerland: 34,608 | 1.1%
Tourist Accommodation (in 2023)
- Resorts: 172 (41,977 beds) – registered | 168 (41,081 beds) – operational
- Hotels: 13 (1,640 beds) – registered and operational
- Guesthouses: 869 (14,018 beds) – registered and operational
- Safari Vessels: 158 (2,918 beds) – registered and operational
The total industry capacity is currently 1,212 tourist properties which give a combined bed capacity of 60,553. On the other hand, the total operational capacity of the industry is currently 1,208 which gives a combined bed capacity of 59,657.
According to statistics, guesthouse properties are currently located in 20 of the country’s administrative atolls; in 115 local islands which gives a combined bed capacity of 14,018.
Bed Capacity Share
- Resorts: 69%
- Guesthouses: 23%
- Hotels: 5%
- Safari Vessels: 3%


